

Three product categories account for 75.5% of the forecast growth in the global printed circuit board (PCB) market in 2026: boards with 18 or more layers, high-density interconnect (HDI) boards and IC package substrates. DETUS Research calculated this share from Prismark's Q1 2026 forecast, which puts global PCB production value at $101.95 billion in 2026, up 18.8% from $85.84 billion in 2025. Conventional single-, double-sided and 4–6-layer boards are forecast to grow by 3.1% to 4.3% and remain a mature, price-competitive market.
The Prismark figures are reproduced in a 2026 company financial disclosure. A separate forecast from TPCA/ITRI puts the 2026 market at approximately $105.2 billion. Both figures are forecasts, not realized full-year results, and should not be averaged because their coverage and assumptions may differ.
Scope note — IC package substrates: Prismark includes IC package substrates in its overall market figures, so DETUS retains them in the market totals, segment comparison and 75.5% growth calculation. They are excluded from the article's core analysis of bare-board PCB fabrication and the 18+ layer supply outlook, because they serve semiconductor packaging and follow different manufacturing processes. Substrate investment projects are mentioned only when needed to distinguish adjacent capacity from PCB fabrication. The gap between advanced and conventional boards explains why some buyers still find competitively priced standard boards in 2026 while others face material allocations, longer lead times and few qualified suppliers.
PCB Industry Statistics and Market Size in 2026
| Measure | Latest figure | How to read it |
|---|---|---|
| Global PCB market value | $101.95bn forecast | Prismark 2026 estimate, not realized sales |
| Global PCB market growth | +18.8% forecast | Value growth, not PCB unit growth or price inflation |
| Growth from 18+ layer, HDI and IC substrates | 75.5% of projected increment | DETUS calculation using one consistent Prismark forecast |
| PCB production value located in mainland China | 57.7% forecast share | By factory geography, not producer headquarters |
| PCB production value located in Europe | 2.1% forecast share | Prismark 2026 forecast, not a current factory count |
| North American PCB book-to-bill, September | 1.77 | Three-month ratio of dollar bookings to dollar shipments in a survey |
| North American PCB bookings, September | +229.4% YoY | Order value, not physical boards produced |
| North American PCB shipments, September | −6.4% YoY | Shipment value for that month, not full-year output |
| European PCB manufacturers | 168 companies / 182 facilities | End-2025 census published in 2026; not year-end 2026 |
Sources: Prismark figures reported in a 2026 issuer filing; Global Electronics Association, October 26, 2026; Data4PCB/in4ma, February 2026.
How Many PCB Manufacturers Did DETUS Analyze?
DETUS reviewed 7,262 company and supplier profiles from nine industry directories, associations and exhibitions, covering 75 countries and territories. After standardizing company names, the research identified 4,207 distinct company-name profiles. It also examined manufacturer-reported facilities, financial data and published pricing. A business can appear in several directories, or operate as a broker, assembler or materials supplier, so these figures describe the reach of the company research and are not a verified count of independent PCB factories.
| Research layer | Observations collected | What the count measures |
|---|---|---|
| Company and supplier profiles reviewed | 7,262 company listings | PCB-industry businesses identified across nine directories, trade bodies and exhibitions; some appear more than once |
| Distinct company-name profiles | 4,207 names | Companies grouped by standardized business name; legal entities and subsidiaries have not all been independently reconciled |
| Companies appearing in multiple industry sources | 1,890 name matches | Matching company names found across at least two source collections; not necessarily separate legal entities or independently confirmed fabs |
| Countries and territories represented | 75 | Countries associated with the businesses profiled; not a complete audit of manufacturing output in all 75 markets |
| European company and supplier listings | 1,239 profiles across 33 geographies | Europe and transcontinental countries represented in the business research; not a count of active plants |
| Industrial facilities and operations examined | 149 locations or operations | Manufacturer-described facilities across 43 business groups or brands, including some assembly, historical and planned sites |
| Economic and industrial indicators analyzed | 51 indicators | Industry forecasts, manufacturer results, material prices, investment and regional data, each interpreted within its own scope |
| Findings prepared for citation | 18 research findings | Calculations and documented observations supported by published industry evidence |
| Direct standardized manufacturer price survey | Not conducted | The study evaluates industry economics and published pricing; it does not claim an original global quote-based price ranking |
The company research covers PCB Directory, EIPC, TPCA, JPCA, KPCA Show, THPCA, IC-PCB Union, PCBLib and Assodel. Businesses appearing in multiple directories were compared by standardized name. A directory entry alone does not prove that a company owns a fabrication plant.
The market-size and regional production estimates do not come from extrapolating the 7,262 company listings. The 2026 market, technology and regional comparisons come from the Prismark industry series. DETUS's contribution is the normalization, comparison, source reconciliation and derived calculations. Industry surveys and company reports each use their own separately reported populations.
PCB Market Trends: Why Advanced Boards Are Growing Faster
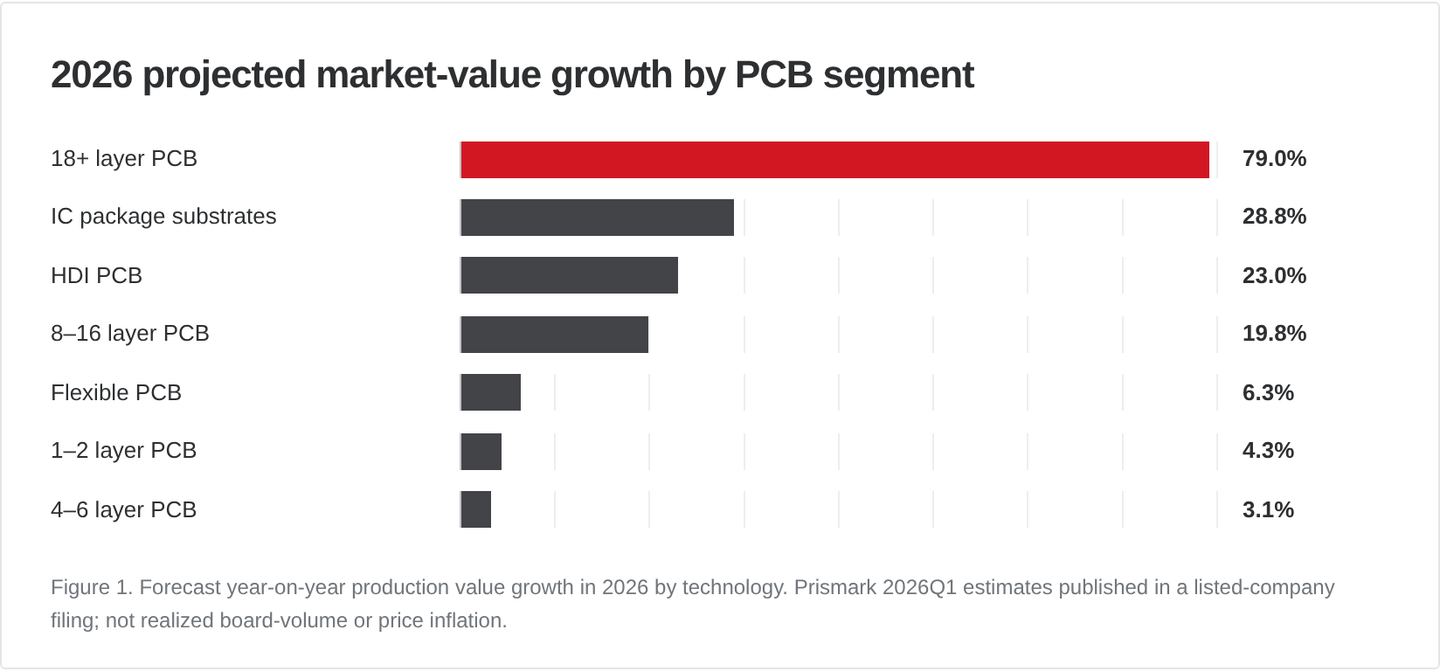
In Prismark's 2026 forecast, the value of 18+ layer boards, HDI boards and IC package substrates grows by 23.0% to 79.0%, while single-, double-sided and conventional 4–6-layer boards grow by 3.1% to 4.3%. The single 18.8% global growth figure hides that split. Prismark's 2025 actuals and 2026 forecasts by category:
| PCB product category | 2025 market value | 2026 forecast | Forecast growth |
|---|---|---|---|
| Single- and double-sided boards | $8.44bn | $8.81bn | 4.3% |
| Conventional 4–6-layer boards | $16.71bn | $17.22bn | 3.1% |
| 8–16-layer boards | $11.45bn | $13.71bn | 19.7% |
| 18+ layer boards | $5.25bn | $9.41bn | 79.0% |
| HDI boards | $16.20bn | $19.92bn | 23.0% |
| IC package substrates | $14.89bn | $19.18bn | 28.8% |
| Flexible circuits | $12.90bn | $13.71bn | 6.3% |
| Total | $85.84bn | $101.95bn | 18.8% |
Source: Prismark Q1 2026 industry dataset as reproduced in this issuer disclosure. Figures rounded for readability. Percentages represent changes in market value, not physical volume, per-board prices or confirmed year-end output.
The value of 18+ layer boards is forecast to grow about 25 times as fast, in percentage terms, as the value of conventional 4–6-layer boards (79.0% versus 3.1%). That does not mean a high-layer board costs 25 times more, or that its price rose 79%. It means growth, technology mix and potential manufacturing bottlenecks differ sharply between the two segments.
Why Are 18+ Layer PCBs Growing So Fast?
AI servers and high-speed networking equipment need more signal routes, dedicated power and ground planes, and tighter control of signal integrity. Higher layer counts help designers support dense connections between processors, memory and networking components. As advanced systems move toward more complex boards, both the number and manufacturing value of high-layer designs can increase. The forecast 79.0% growth is in market value; the data do not isolate how much comes from physical output, more complex board specifications or pricing. The segment also starts from a smaller market base than conventional PCB categories.
HDI PCB Market Growth and AI Infrastructure Demand
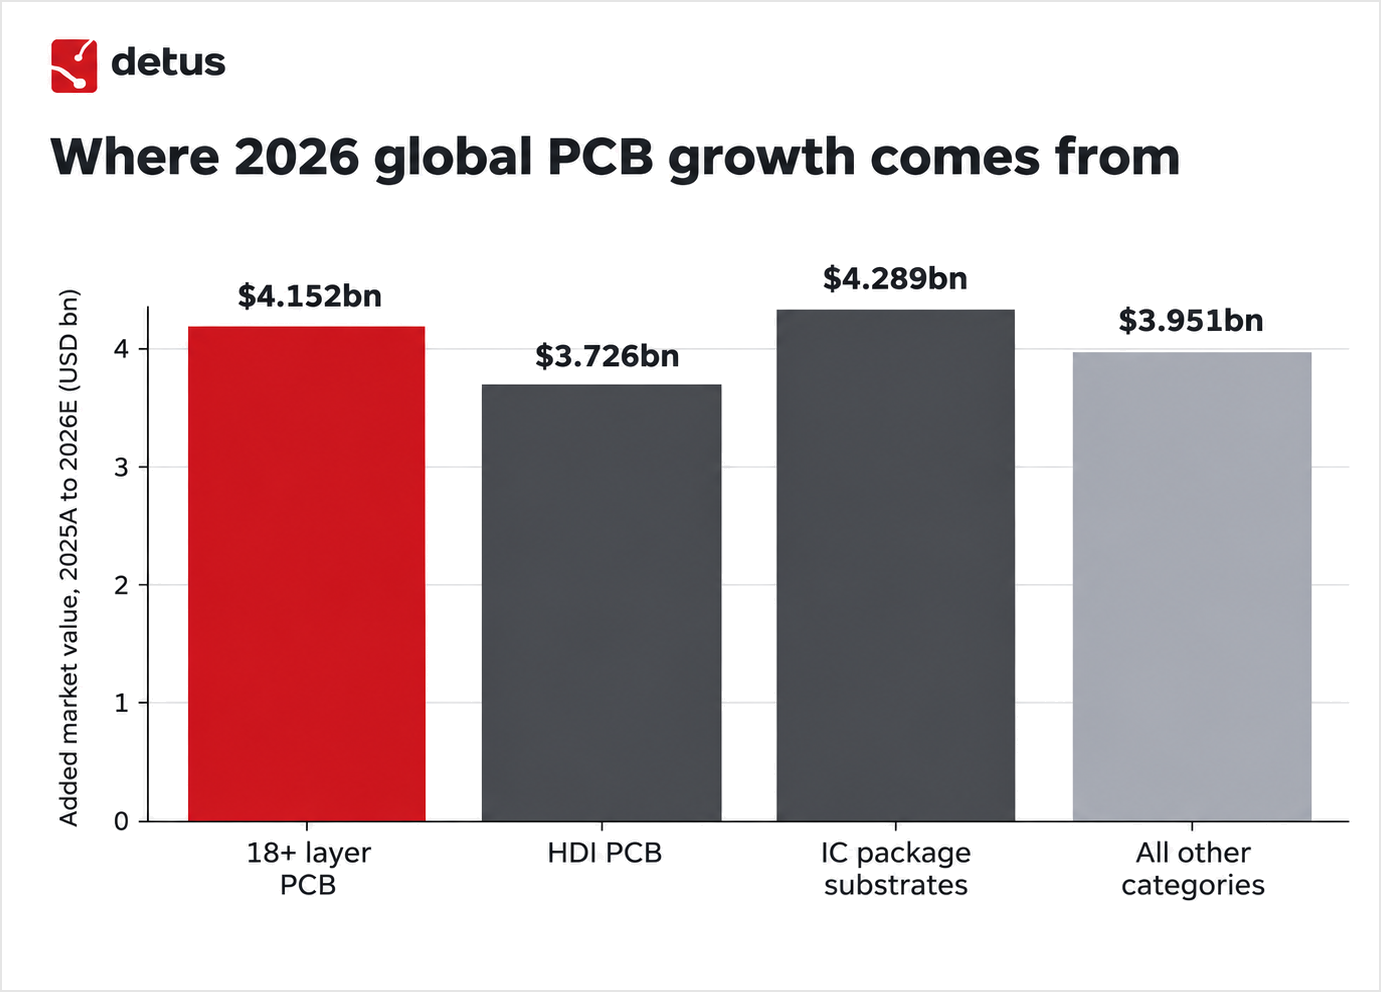
Prismark projects that total PCB market value will increase by $16.12 billion between 2025 and 2026. The added market value by category is approximately:
- 18+ layer PCB: $4.15bn
- HDI: $3.73bn
- IC package substrates: $4.29bn
- All other PCB categories combined: $3.95bn
The three advanced categories add $12.17bn, or 75.5% of the projected worldwide increase. Their share of the total market rises from approximately 42.3% in 2025 to 47.6% in the 2026 forecast.
A factory that produces conventional four-layer boards cannot necessarily replace a customer-qualified supplier of high-layer networking or HDI boards. As demand shifts toward these technologies, qualified capacity tells buyers more than aggregate capacity.
The 75.5% figure measures where demand value is concentrating, not how busy factories are. Future bottlenecks are more plausible in technologies that need specialized materials, equipment and customer qualification than across every factory producing ordinary rigid boards.
Global PCB Manufacturing Industry: Production by Region
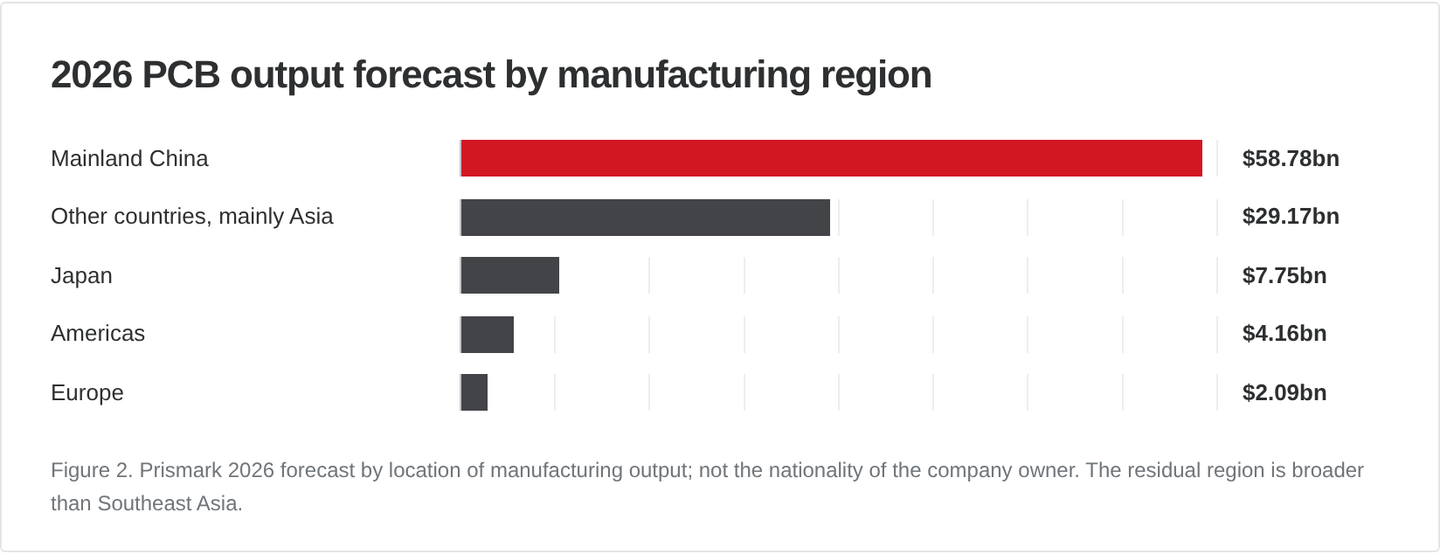
Mainland China is forecast to produce 57.7% of global PCB production value in 2026 ($58.78bn), and Europe 2.1% ($2.09bn), measured by the location of factory output in Prismark's regional forecast.
Location needs a precise definition. An electronics brand may be headquartered in Europe, use a sourcing company in the United States and have its bare boards manufactured in Asia. For an industrial benchmark, those are three different locations. The table below uses factory location only.
| Manufacturing region | 2026 production value forecast | Share of global value |
|---|---|---|
| Mainland China | $58.78bn | 57.7% |
| Other countries, mainly in Asia | $29.17bn | 28.6% |
| Japan | $7.75bn | 7.6% |
| Americas | $4.16bn | 4.1% |
| Europe | $2.09bn | 2.1% |
Source: Prismark regional industry table in a 2026 issuer disclosure. “Other countries” is the source's residual category and must not be read as Southeast Asia alone.
On this basis, China is projected to manufacture about 28 times Europe's output by value in 2026, and to account for approximately 56.6% of the projected dollar increase in worldwide PCB output between 2025 and 2026.
Europe's smaller output value does not make its plants irrelevant. European manufacturers retain specialist capabilities in high-mix, lower-volume industrial, aerospace, defense and medical applications. Buyers in those sectors often value technical communication, documented processes, qualification, traceability and domestic supply resilience, none of which an average board price captures.
European PCB Manufacturing: Companies, Capacity and Consolidation
Research published by Dieter Weiss of Data4PCB/in4ma in February 2026 counted 168 PCB manufacturers and 182 facilities in Europe at the end of 2025, after the loss of 11 manufacturers during that year. European PCB revenue rose 2.4% in euros in 2025, while the worldwide industry grew much faster. Source.
Revenue inside that population is highly concentrated. According to the published Data4PCB revenue distribution, 41 manufacturers with revenue above €10 million generated 78.8% of European PCB revenue, while the 60 manufacturers below €2 million generated 2.9%. The rest sit in the middle of the distribution. An industrial directory can list dozens of legitimate small specialists without those listings indicating equivalent throughput or purchasing power, so counting suppliers is a poor proxy for productive capacity.
An international PCB benchmark needs at least four separate fields: economic group, operational fabrication site, technological role and measured production or revenue. A fifth field, geographic plant location, prevents the headquarters of a multinational from being mistaken for its manufacturing country.
How 2026 acquisitions changed European PCB ownership
Acquisitions in 2026 reduced the number of independent PCB groups in Europe. Somacis completed the acquisition of the ACB Group, which has facilities in Belgium and France, after its earlier acquisition of Dyconex. On November 4, 2026, ILFA announced that its acquisition by TTM Technologies had closed.
These deals reduce the count of independent economic groups but do not automatically mean a closed factory or lost production capacity. Comparing the 2024 Top 30 European list with a 2026 ownership list requires a corporate-parent crosswalk, and manufacturing sites, legal entities and ultimate parent companies should be recorded separately. Sources: Somacis / ACB transaction; ILFA closing announcement.
PCB Industry Trends: Demand, Orders and Manufacturing Capacity
North American PCB statistics for 2026 show order value rising much faster than shipment value, which is a reason not to overstate demand. In September 2026, the Global Electronics Association reported PCB bookings up 229.4% year over year, while shipments fell 6.4% in the same month. Its three-month book-to-bill ratio was 1.77, meaning surveyed companies booked $1.77 in orders for each $1 in billed sales over that period. Source.
The monthly bookings and shipments figures are year-on-year changes; the book-to-bill ratio covers three months. Together they show a large order pipeline alongside volatile shipment conversion. They do not show that physical manufacturing capacity suddenly increased or that board prices rose 229.4%.
What company reports add to the demand picture
Reading the same quarter through several reporters makes the gap between order books and physical demand easier to see. These data series are independent and are not components of one global sample:
| Reporter and period | Reported indicator | Practical interpretation |
|---|---|---|
| Global Electronics Association, North America, September 2026 | +229.4% bookings YoY; −6.4% shipments YoY | Incoming order-value pressure and shipment-value divergence in a sampled manufacturing population |
| Global Electronics Association, year-to-date through September | +56.1% bookings; +13.3% shipments YoY | Longer-window movement is less extreme than September alone |
| NCAB Group, Q3 2026 | +166% order intake; +54% sales; 1.79 book-to-bill | Distributor/sourcing network; forward orders and prices explain part of nominal growth |
| TTM Technologies, Q3 2026 | 2.13 book-to-bill; $1.204bn quarterly sales | Major producer with aerospace/defense and advanced electronics exposure; not an ordinary PCB-only market survey |
| TTM, Data Center & Networking end market, Q3 | 41% of TTM revenue; +115% YoY | Direct reported exposure to AI infrastructure demand, not evidence about AI-assisted layout tools |
| TTM, Aerospace & Defense end market, Q3 | 34% of TTM revenue; +21% YoY | A second differentiated demand driver with distinct qualification requirements |
Sources: Global Electronics Association; NCAB Group; TTM Q3 2026 filing. Year-to-date figures are different measurement periods from September monthly figures; the companies also report different business mixes.
Is PCB Overbooking Creating Artificial Demand?
NCAB Group's Q3 2026 report showed 166% year-on-year order-intake growth. NCAB management estimated that forward orders contributed about 80 percentage points and higher prices about 50 percentage points of its 155% comparable organic order growth. The combined 130 percentage points are management estimates of influences on order value, not an inflation rate or a universal PCB price index. A factory making only slightly more boards could still report much higher nominal orders if customers order earlier, change product mix or accept higher prices.
Orders placed early to protect future delivery can create an apparent boom in order books going into 2027. Procurement teams should check whether those orders turn into sustained shipped output, whether orders move between quarters, and whether new capacity loosens material allocations.
This raises a question familiar from the semiconductor shortages of 2020–2022: are customers over-ordering to secure supply? Material allocation, customer prioritization and advance ordering are already evident, and NCAB estimated that forward orders contributed roughly 80 percentage points to its Q3 2026 comparable organic order-intake growth. That does not establish widespread double ordering of the same custom boards across suppliers. It does mean reported bookings can run ahead of immediate consumption, creating a potential inventory correction risk if lead times normalize. Source: NCAB Q3 2026.
Six metrics for tracking PCB supply pressure
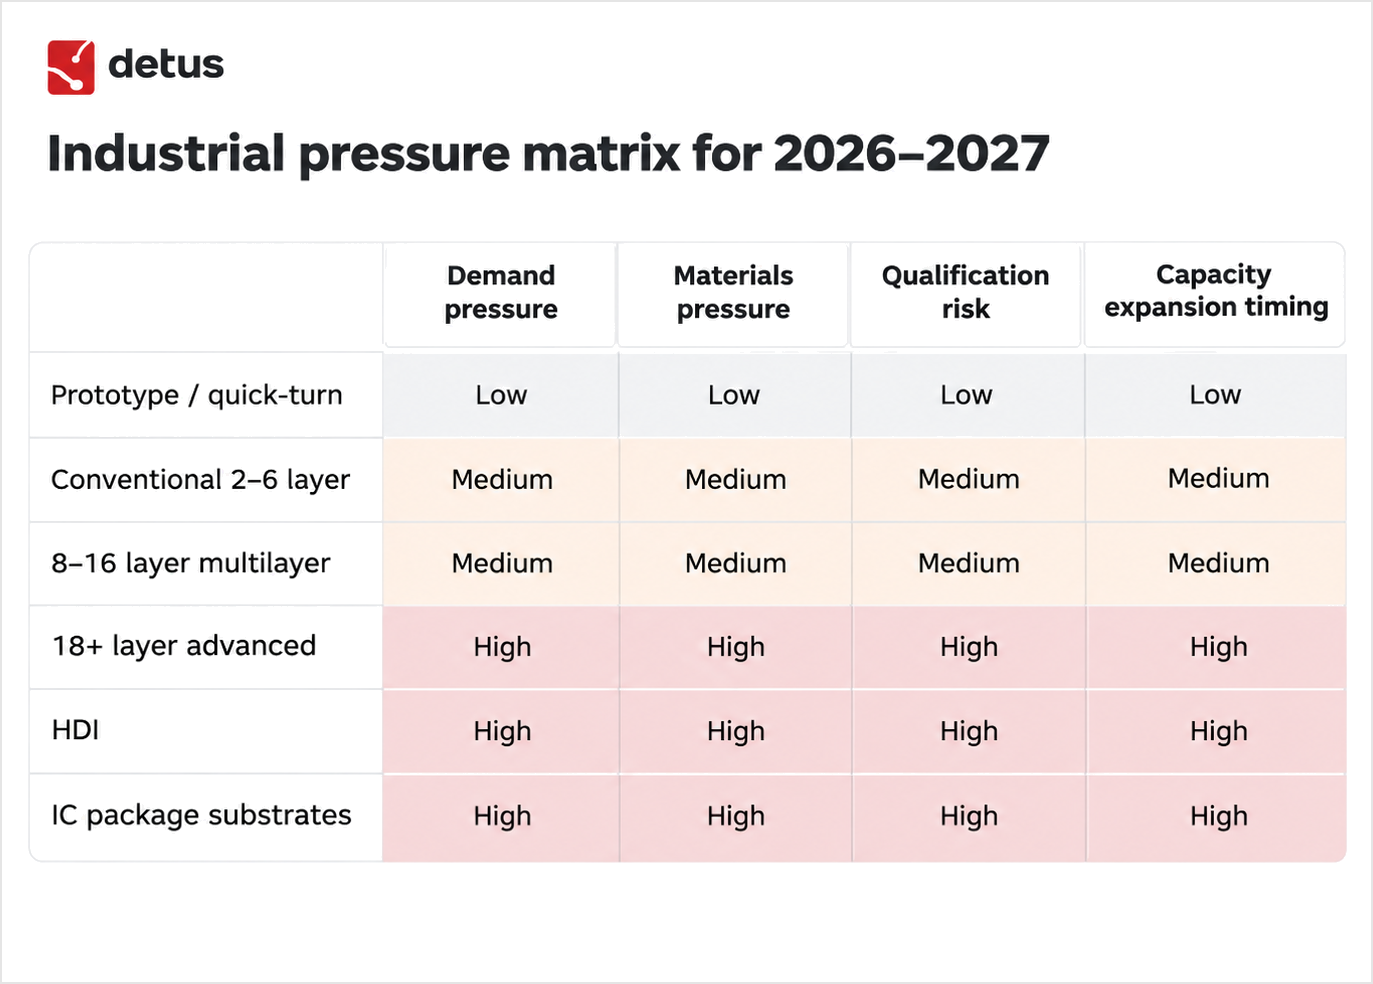
A PCB pressure dashboard should show six indicators separately instead of collapsing incomparable signals into one opaque score:
| Dimension | What to monitor | Why a buyer should care |
|---|---|---|
| Demand | Bookings, shipments, book-to-bill, cancellations | Distinguishes a sustainable demand trend from order pull-forward |
| Materials | Copper foil, CCL, resin, glass fabric, allocation notices | May constrain production even if PCB fab equipment is available |
| Qualified capacity | Actual line output, yield, lead time, approved process capability | Nominal factory capacity is not the same as usable capacity |
| Technology mix | 18+ layers, HDI, IC substrates versus conventional boards | Explains why shortages are uneven across products |
| Geography | Factory location, trade exposure, freight and lead times | Identifies sourcing concentration and logistics vulnerabilities |
| Supplier structure | Parent ownership, internal fabs, outsourcing partners | Prevents mistaking multiple suppliers for independent capacity |
What not to do: turn these into a single “PCB shortage score” without a defensible weighting model and representative data. The underlying indicators are more useful to procurement teams than an invented precision ranking.
PCB Supply Chain Pressures: Materials, Prices and Lead Times
AI data-center demand can raise costs for conventional PCB buyers because advanced and conventional boards draw on the same upstream materials: copper foil, copper-clad laminate (CCL), resins and electronic glass fabric.
In October 2026, the Global Electronics Association identified copper foil, resin and electronic glass fabric as material bottlenecks, particularly in high-performance grades. When material manufacturers prioritize higher-value grades, procurement conditions can change for conventional users too. Source.
The mechanism runs in sequence: advanced demand increases → scarce specialty materials and production capacity are allocated → lead times and purchasing terms change → some costs can be passed downstream. Each step needs separate verification. A rise in copper prices, for example, is not automatically equal to a rise in the price of a finished PCB: the pass-through depends on design, material use, scrap, supplier contracts, yield, volume and margin.
TTM Technologies provides a direct demand-side indicator: in Q3 2026, data center and networking contributed 41% of group sales, and the company attributed strong growth in this market to AI-related demand. TTM's business mix includes activities beyond standard bare-board PCB fabrication, so 41% cannot be treated as the share of the global PCB market attributable to AI.
AI infrastructure demand and AI-assisted PCB design software are separate effects. Infrastructure demand is observable in supplier results and investment decisions. Design software may make design easier and stimulate more projects, but better verification may also reduce the number of failed prototype revisions. The industry data reviewed here do not establish the net effect of AI design tools on physical PCB orders.
Material supply and fabrication capacity are separate constraints
Adding drilling, imaging and plating machines in PCB factories will not resolve a shortage of low-loss laminates, selected copper foil or electronic glass fabric. Opening a laminate line does not add a PCB fabrication line either. The two kinds of project act at different points in the supply chain.
Kingboard's 2026 interim disclosure described strong upstream materials demand and restrictions affecting electronic fiberglass production. It reported four newly commissioned specialty electronic-glass yarn kilns, bringing its reported total of specialty kilns to five. This is a company-specific supply response, not a worldwide count of glass capacity.
A broader commodity indicator in the DETUS research register is copper. The World Bank Pink Sheet monthly copper average for October 2026 was around $14,508 per metric ton, roughly 35.1% higher year on year, as displayed with the underlying series and date. It is a commodity price, not a PCB-specific copper-foil procurement price. Kingboard's kilns and the copper price are both potential input-cost signals; neither establishes an equal percentage rise in finished PCB selling prices.
These observations support three manufacturing-cost mechanisms: direct input inflation, allocation of upstream capacity toward higher-value materials, and longer qualification and ramp times when a customer switches to an alternative material. The effects differ sharply between a standard two-layer pooled order and an advanced AI-server board.
PCB Manufacturing Capacity Forecast for 2027
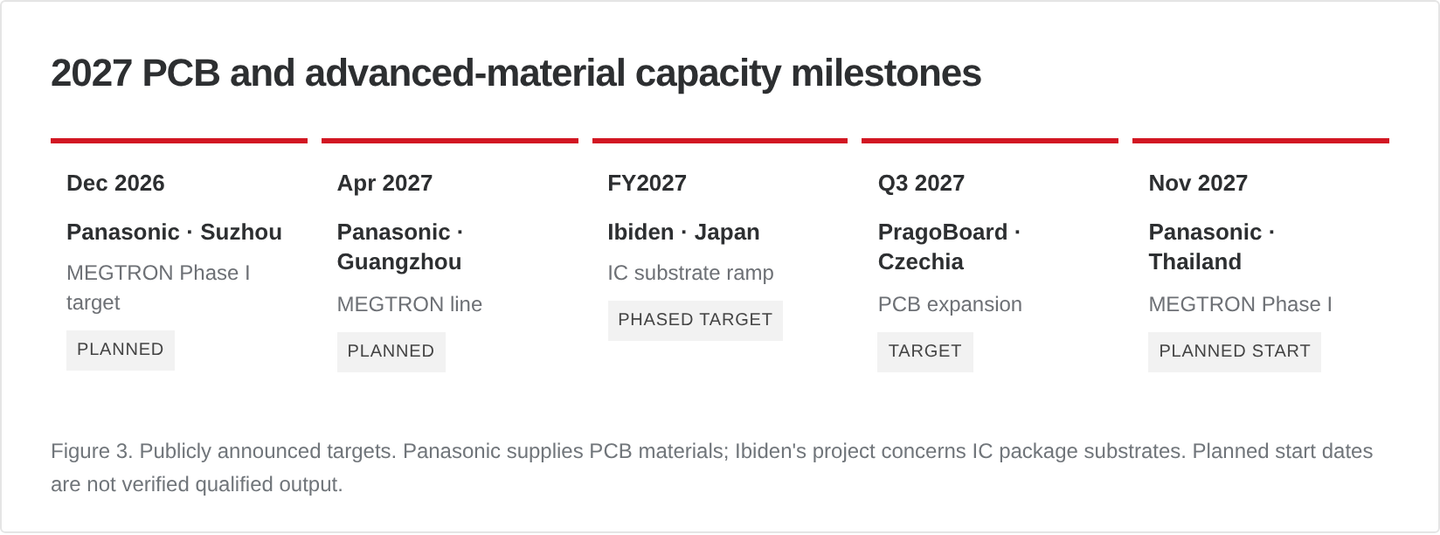
Announced capacity milestones through 2027 include Panasonic MEGTRON laminate lines in China and Thailand, Ibiden IC substrate capacity in Japan and a new PragoBoard PCB campus in the Czech Republic. Of the projects in this tracker, only PragoBoard's adds bare-board fabrication; the others add materials or substrates. An announcement is not output: a facility can be built, equipped and started before it reaches customer qualification, reliable yields or full throughput.
| Target | Company / location | Planned addition | What it actually adds |
|---|---|---|---|
| December 2026 | Panasonic, Suzhou, China | MEGTRON Phase I mass-production start | High-performance PCB materials, not a new bare-board fab |
| April 2027 | Panasonic, Guangzhou, China | MEGTRON line operations | Additional high-speed laminate capacity, subject to ramp |
| FY2027 onward | Ibiden, Japan | Advanced IC package substrate capacity | Semiconductor packaging substrates; different from standard PCB fabs |
| Q3 2027 target | PragoBoard, Czech Republic | New automated PCB campus | Planned expansion of actual bare-board production |
| November 2027 | Panasonic, Ayutthaya, Thailand | MEGTRON Phase I operations | Specialty materials; not immediate full-volume output |
Company sources: Panasonic's October 2026 investment announcement, Panasonic Guangzhou announcement, Ibiden investment plan, PragoBoard's factory plan.
PragoBoard publishes a transparent target: 90 panels per day at its existing operation and a planned 500 panels per day for the 2027 campus, a proposed 5.6× increase. That is a company target, not measured 2027 output, and not necessarily usable capacity across all board technologies. Source.
Panasonic's October 30 announcement describes approximately ¥67 billion (approximately US$423 million) of additional MEGTRON investment in China and Thailand, including later phases scheduled for 2028 and 2029. USD equivalents here and below use approximate exchange rates as of November 4, 2026; they are for comparison, not reported transaction values. Those later phases should not be counted as 2027 capacity. Source.
Ibiden's planned ¥500bn (approximately US$3.16bn) capital program for FY2026–FY2028 targets advanced IC package substrates, not ordinary bare PCBs. Ibiden investment notice.
From announcement to qualified output: what a 2027 capacity tracker should record
New PCB capacity relieves a bottleneck only after five conditions are met: equipment commissioning, reliable material access, stable production yield, customer qualification and delivery at a commercially viable cost.
DETUS records each project's status as a separate stage: announcement, permit or investment-promotion application, construction, equipment commissioning, first commercial output and qualified volume production. These stages can be many months apart and cannot be collapsed into a single factory-opening date.
The gap between announcement and qualified output explains how the industry can report new factories, high aggregate revenue growth and persistent constraints in specific technologies at the same time. The useful question for 2027 is how much additional qualified output will be available for the technology a customer needs, and when.
Regional PCB Manufacturing: India and Thailand
India: bare-board imports close to 90% of demand
India's bare-board PCB imports equaled roughly 88% of its PCB demand in 2024–25, according to a NITI Aayog report published in 2026. The report puts domestic demand at about $4.2 billion, imported bare PCBs at approximately $3.7 billion and local production at about $0.6 billion. The figures do not reconcile perfectly because of differences in scope, rounding and reporting windows. They are 2024–25 historical estimates and a baseline for India's 2026–27 capacity-building challenge, not a claim that India still imports exactly 88% in November 2026.
The same source reports domestic sourcing growth of around 27.3% CAGR over the prior three years and an ambition to expand PCB production to $14bn by 2029–30. That is a policy and industry goal, not a forecast of 2027 factory output.
The buyer lesson is that local assembly capacity and local bare-board fabrication are distinct. A country with extensive electronics production may still rely heavily on imported substrate boards, laminates or advanced processes. Sourcing resilience depends on verifying exactly which fabrication technologies are available domestically.
Thailand: 224 investment applications are not 224 factories
Thailand's Board of Investment reported 224 PCB and materials investment-promotion applications worth about THB 331 billion (approximately US$9.84 billion) between 2023 and the first half of 2026. Applications show investment intention, not 224 completed or operating PCB factories. A realistic 2027 outlook needs a dated follow-up on each project's construction, commissioning and production status. Thai BOI.
India is trying to close a large domestic production gap; Thailand has attracted substantial declared investment. Neither statistic proves how much qualified PCB output will exist in 2027.
PCB Sourcing and Manufacturing Costs: What Buyers Should Know
The right 2027 response depends on the type of board being purchased. For mainstream prototypes, competitive quotes, manufacturing rules and total delivered cost remain decisive. For HDI, 18+ layer boards and high-reliability applications, qualification and material access may be harder constraints than the advertised unit price.
| If you buy… | The practical 2027 action | Evidence to request |
|---|---|---|
| Standard 2–6-layer PCB | Compare total landed cost and promised turnaround, not starting price | Complete quote, freight terms, finish, quantity and lead-time conditions |
| Industrial multilayer boards | Establish a qualified backup with matching process capability | Stackup, material equivalence, yield, test coverage, recent delivery performance |
| HDI / high-layer networking boards | Qualify capacity early and discuss materials allocation | Approved stackup, advanced laminate supply, queue time, process capability |
| Medical / aerospace / defense PCB | Protect traceability and approved manufacturing flows | Site identification, certifications, lot traceability and change-control procedures |
| Long-life industrial electronics | Examine material substitution and lifecycle risk | Alternative laminate approvals, end-of-life notices and requalification costs |
For PCB suppliers, the opportunity is equally segmented. A manufacturer unable to match the scale of Asian volume production may be able to differentiate through specialized processes, documentation, faster engineering feedback, low-volume flexibility and qualified local supply. Those capabilities should be demonstrated with data, not asserted in general terms.
PCB supplier-risk checklist: what to verify before trusting a quote
Before relying on a quoted lead time, an announced capacity figure or a headline order-book spike, ask the supplier for evidence that matches your board family:
- Does the supplier own the fabrication plant or subcontract it, and which factory will actually produce the board?
- In which region will the board be fabricated?
- Which material grade is specified, and is it allocated to this order?
- Which layer and via technology is required, and has that process already been qualified?
- What are the standard and expedited lead times, and what happens if the quoted production slot slips?
- What are the normal yield and test coverage?
- How much monthly panel or area capacity is allocated?
- Are any substitution or requalification requirements declared?
A sales office in a country is not proof of a PCB fabrication plant in that country.
Capacity figures also need matching units. A high reported factory area is not automatically high monthly board output, and an investment figure is not an operating-capacity figure. Among the facilities DETUS reviewed, the Swedish ICAPE-MMAB site reports 550 m²/month of capacity, while PragoBoard in the Czech Republic targets an increase from 90 panels/day toward 500 panels/day. The units differ, and the PragoBoard figure is a target, not a realized output series, so the two cannot be summed into one capacity index. ICAPE-MMAB; PragoBoard.
2027 PCB Industry Outlook: Will the 18+ Layer Shortage Ease?
There is no confirmed end date for supply constraints in 18+ layer PCBs. Demand from AI servers and high-speed networking requires specialized processes, high-performance laminates and qualified factories that cannot be replaced immediately by conventional PCB capacity. Planned materials and manufacturing investments could ease pressure, but commissioning, yield stabilization and customer qualification may delay the availability of usable high-layer capacity. This is a segment-specific supply question, not evidence of a shortage across every PCB category.
NCAB's October 2026 report stated that the company did not expect the supply situation to improve until late 2027 at the earliest. That is NCAB's market assessment, not a universal forecast; other capacity additions and category-specific supply conditions may produce different outcomes.
For 18+ layer PCBs specifically, three indicators matter most in 2027: the conversion of high-layer orders into shipments, newly qualified high-layer production capacity, and the availability and cost of high-performance laminates and other critical materials. Improvements in all three would provide stronger evidence of easing constraints than a factory announcement or an isolated surge in orders.
Frequently Asked Questions
How big is the global PCB market in 2026?
Prismark forecasts global PCB production value of $101.95 billion in 2026, up 18.8% from $85.84 billion in 2025. TPCA/ITRI has separately published an estimate of about $105.2 billion. Both are projections, not final 2026 results, and different forecasts should not be combined without examining their coverage.
Which PCB segment is growing fastest in 2026?
In Prismark's 2026 forecast, 18+ layer boards grow fastest among the listed categories, at 79.0% by market value, compared with 3.1% for conventional 4–6-layer boards. Together, 18+ layer boards, HDI boards and IC package substrates account for 75.5% of the forecast market growth, according to DETUS Research calculations.
Which country manufactures the most PCBs?
Mainland China is projected to produce about 57.7% of worldwide PCB production value in 2026 ($58.78 billion), measured by location of manufacture in Prismark's regional forecast. Europe's share is 2.1%.
How many PCB manufacturers are there in Europe?
Data4PCB/in4ma counted 168 PCB manufacturers operating 182 facilities in Europe at the end of 2025, after the loss of 11 manufacturers during that year. The 41 manufacturers with revenue above €10 million generated 78.8% of European PCB revenue.
Why are PCB lead times increasing?
PCB lead times can increase when demand and advance orders outpace available qualified manufacturing and upstream material capacity. In October 2026, the Global Electronics Association identified copper foil, resin and electronic glass fabric as specific bottlenecks.
Will the 18+ layer PCB shortage end in 2027?
There is no verified end date for constraints affecting 18+ layer PCBs. The supply outlook depends on high-performance material availability and the ramp-up of customer-qualified high-layer fabrication capacity, not just announced factory investments. NCAB Group did not expect broader supply conditions to improve before late 2027 at the earliest; that assessment is not a specific forecast for every 18+ layer board.
Does AI PCB design software cause PCB prices to rise?
There is not enough evidence to establish that claim. Demand from AI data-center infrastructure is documented in supplier results; the net effect of AI-assisted electronic design on fabricated-board order volumes has not been measured in the datasets DETUS reviewed.
Research Methodology
DETUS reviewed 7,262 company and supplier listings from nine industry sources (PCB Directory, EIPC, TPCA, JPCA, KPCA Show, THPCA, IC-PCB Union, PCBLib and Assodel), standardized them into 4,207 distinct company profiles across 75 countries and territories, and examined 149 manufacturer-described facilities and operations belonging to 43 business groups or brands.
Market size, segment and regional figures come from Prismark 2026Q1, republished in an October 2026 issuer filing. The 75.5% growth share is a DETUS calculation from those tables:
($4.152bn + $3.726bn + $4.289bn) / ($101.954bn − $85.836bn) = $12.167bn / $16.118bn = 75.5%
Demand, materials and capacity data come from Global Electronics Association statistics, TTM, NCAB and ICAPE disclosures, Data4PCB/in4ma, NITI Aayog, Thailand's Board of Investment and company investment announcements. Each figure is labelled as historical, forecast, company-reported or DETUS calculation.